Scan QR code or get instant email to install app

Question:
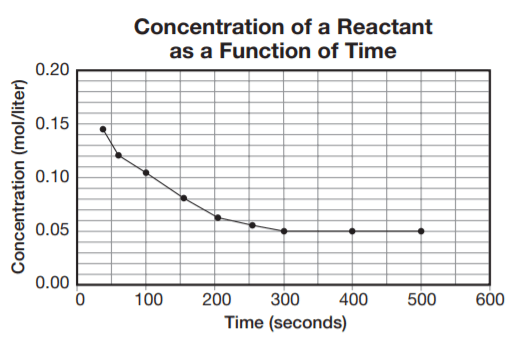
The following graph shows how the concentration (amount per unit volume) changes with time. What information can be obtained from the data?
A
The amount of reactant first decreases and then stays constant.
explanation
Initially, the concentration decreases. There is no information about the product on the chart. At 500 seconds, the concentration is not zero. At 300 seconds, the concentration is lower than at other times, at the start of the experiment.
Take more free practice tests for other GED topics with our ged practice test now!
Related Information
Comments