Scan QR code or get instant email to install app

Question:
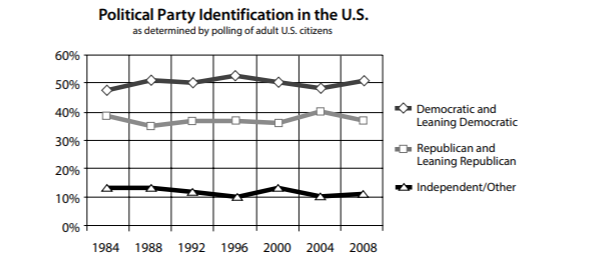
Which conclusion is supported by information presented in the graph?
A
The breakdown of Americans who identify with each political party did not change much between 1984 and 2008.
explanation
The graph provides supporting evidence for the statement that the breakdown of Americans by political party did not change much. The graph doesn’t give any information about how independents voted in any of these years . The Democratic and Republican parties are competitive despite the larger numbers of Democrats because the groups that tend to identify with the Democratic Party are groups that also tend to have lower-than-average voter turnout. Independents comprise 10 to 13 percent of the American public , and the Democratic Party is larger than the Republican Party .
Take more free practice tests for other GED topics with our ged practice test now!
Related Information
Comments