Scan QR code or get instant email to install app

Question:
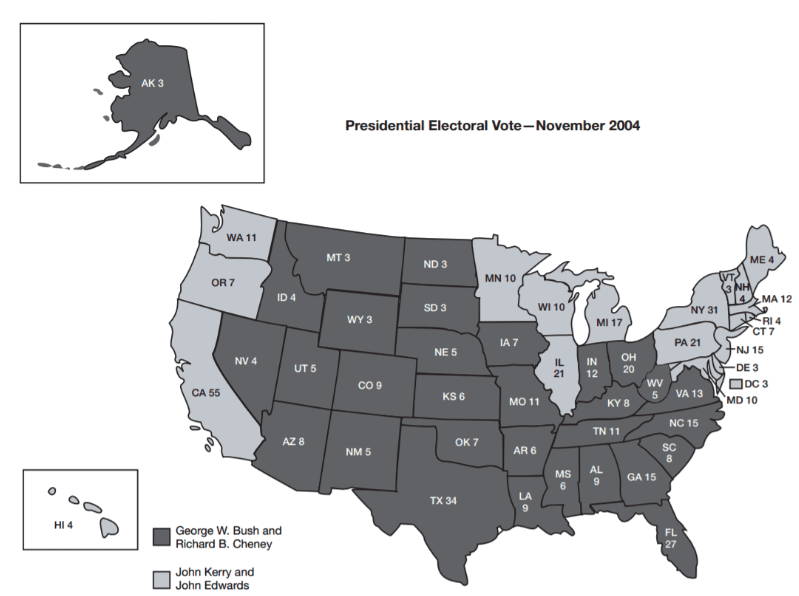
Which of the following conclusions can you make from the information in the map?
A
There were distinct regional differences in voting patterns.
explanation
The map highlights the regional differences in the 2004 presidential election. It does not support any of the other statements.
Take more free practice tests for other GED topics with our ged practice test now!
Related Information
Comments